Machine Learning Classification of Building Damage in Post-Storm Event Assessment

Group Name: EY-Groupie2024WG | Public Leaderboard: 17/230 (Top 8%)
EY Open Science Data Challenge Program 2024
Inference samples predicted by our trained model.

Inference samples predicted by our trained model.

Summary

This competition requires participants to prepare the dataset from satellite images of San Juan pre- and post-storm. With this dataset, participants are required to classify each building in the validation dataset into one of four categories: undamaged residential buildings, damaged residential buildings, undamaged commercial buildings, and damaged commercial buildings. This posed one of the greatest challenges in the competition. It is difficult to determine the class of a building from these images, as some buildings are indistinguishable, especially for those unfamiliar with the area. Even if we can make a guess, it might be done with low confidence if there are no reliable sources available to cross-check our annotations. Our success can be attributed to the quality dataset collection process. To ensure the collection of a high-quality dataset, our group spent the majority of our time determining the class of each building in every tile by referencing multiple reliable sources, including Google Maps, OpenStreetMap, and Google Maps Street View 3D. Referring to these reliable sources provided greater confidence in annotating each building, contributing to the quality dataset.

Participants were tasked with building a model capable of accurately predicting each building's class, which presented another challenge due to the imbalanced dataset. We proposed an approach where we attempted to balance the dataset by introducing synthetic images into the training dataset through fine-tuning the Stable Diffusion 2 model. Unfortunately, we were unable to increase our score as adding synthetic images to the training dataset had minimal impact on the model's performance. Numerous experiments with different model variants and hyperparameter settings also yielded minimal improvements in the score. Given more time, we could potentially increase the score by exploring other methods of model development, such as incorporating different model architectures, conducting further hyperparameter tuning, and collecting more diverse datasets.

Despite these challenges, we are immensely grateful, and our collective efforts enabled us to achieve a final mAP50 score of 0.48, placing us in the top 8% of all teams, ranking 17 out of 230.

Competition Overview

This overview is adapted from the original competition description.

1. Objective: The objective of the challenge is to develop a machine learning model capable of identifying and detecting "damaged" and "undamaged" coastal infrastructure, including residential and commercial buildings, affected by natural disasters such as hurricanes and cyclones.

Participants will be provided with pre- and post-cyclone satellite images of an area impacted by Hurricane Maria in 2017. The task is to build a machine learning model capable of detecting four different types of objects in the satellite images of cyclone-affected areas:

  • Undamaged residential buildings
  • Damaged residential buildings
  • Undamaged commercial buildings
  • Damaged commercial buildings

2. Dataset Used:

Mandatory dataset:

  • High-resolution panchromatic satellite images before and after a tropical cyclone: Maxar GeoEye-1 (optical)


Key Challenges

1. Dataset Collection: Manually annotating all four classes in the provided high-resolution satellite dataset from Maxar's GEO-1 mission, covering an area of 327 sq.km of San Juan, Puerto Rico, is a time-consuming task. With only one month for the competition duration, this task poses significant challenges in terms of time and energy allocation.

2. Imbalanced Dataset: The dataset comprises four classes of building damages: undamaged commercial buildings, undamaged residential buildings, damaged commercial buildings, and damaged residential buildings. Our analysis reveals that damaged classes are underrepresented compared to undamaged ones. Additionally, residential buildings are more common than commercial buildings. This imbalance can introduce bias and affect the performance of our model, particularly towards the majority class.


Proposed Approach

1. Parallel Annotation: Instead of annotating the entire dataset as a single unit, we adopt a strategy of segmenting the dataset into multiple tiles, each with a dimension of 512x512 pixels. We chose this specific dimension to closely match the size of the validation dataset, ensuring consistency between our training and evaluation processes. These tiles are distributed among team members to enable parallel annotation, thereby enhancing efficiency.

2. Annotation of Mixed-Area Tiles Only: Our analysis of the validation dataset indicates that it covers regions with mixed land use, covering both commercial and residential areas. Therefore, we focus our annotation efforts solely on regions characterized by this mixed land use, optimizing resource utilization and annotation accuracy.

3. Cross-Checking Building Classes for Accurate Labeling: Annotating building classes accurately poses a significant challenge, particularly without reliable reference points and solely rely on guessing. To address this, our approach incorporates the generation of Google Maps and OpenStreetMap tiles, aligned with the center coordinates of each dataset tile. Additionally, we utilize shapefiles provided by the organizers to identify building footprints. Furthermore, we extract center coordinates for each tile and leverage them to access 3D views of the corresponding areas on Google Maps. This effort of cross-referencing process ensures the accuracy of our manual annotations by validating them against multiple reliable sources.

4. Synthetic Image Generation for Handling Imbalanced Datasets: To mitigate the class imbalance in our dataset, particularly in representing damaged building classes, we propose employing a synthetic image generation technique. We draw inspiration from recent research outlined in a paper detailing the application of Stable Diffusion 2 with LoRa adaptation for generating synthetic aerial images. By fine-tuning this model, we aim to create synthetic images of damaged building classes, thus narrowing the representation gap in our training dataset and reducing model bias. The paper we reference in our replication efforts can be found at the following link: https://arxiv.org/abs/2311.12345

5. Transfer Learning through Fine-Tuning of a Pre-trained Model: To enhance the performance of our model, we employ transfer learning by fine-tuning our dataset with a pre-trained model. Specifically, we utilize the YOLOv8 model developed by Ultralytics as our pre-trained model. Leveraging transfer learning allows us to capitalize on the knowledge gained by the pre-trained model on a related task, facilitating faster convergence and potentially improving the accuracy of our predictions.


Methodology

1. Data Collection: 
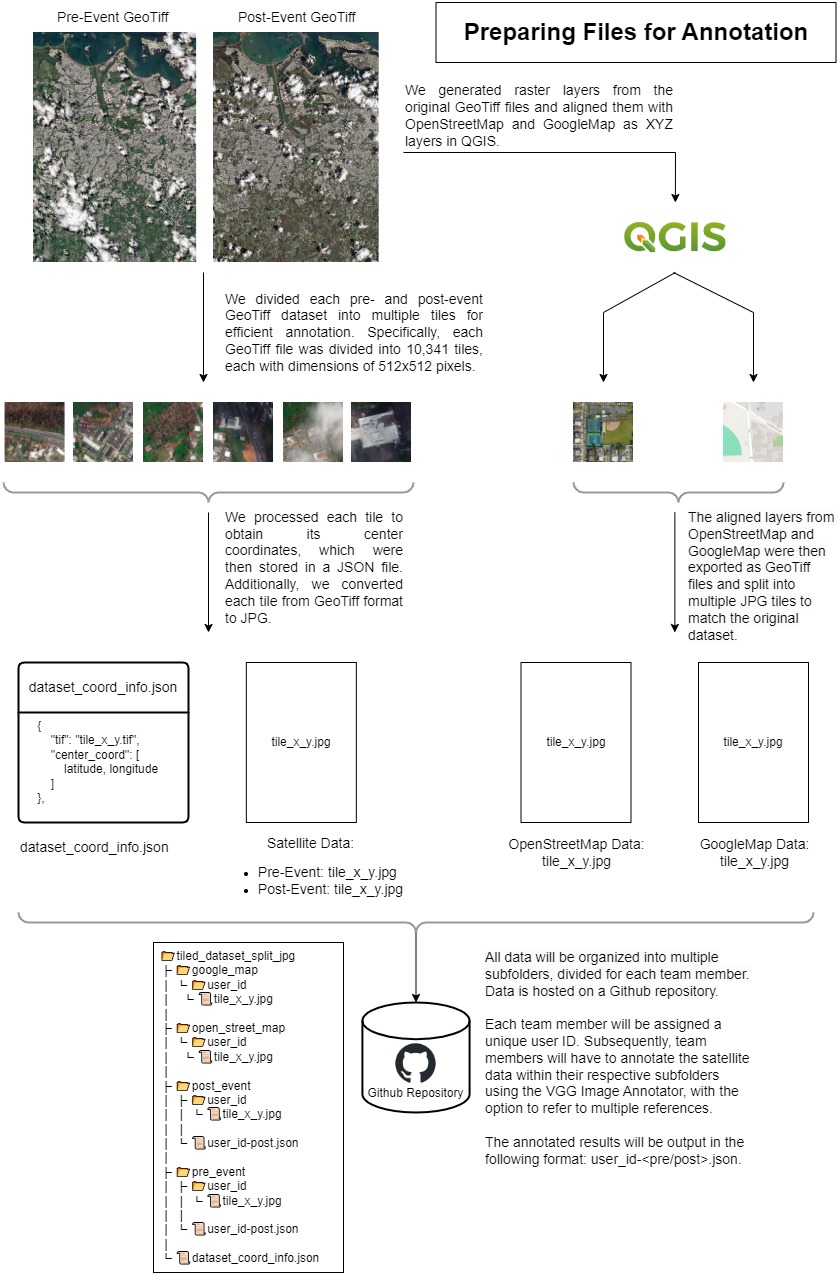
The dataset consists of pre- and post-event satellite imagery partitioned into multiple tiles. Initially in GeoTiff format, each tile is converted to JPG to reduce storage consumption. With a total of 21,460 tiles, including both pre- and post-event images, we generated OpenStreetMap and GoogleMap representations for each tile by aligning and matching raster layers in QGIS. Additionally, building footprint information was extracted by aligning shapefile raster layers with the GeoTiff dataset. Manual filtering was performed to select only images with mixed areas of residential and commercial zones. 
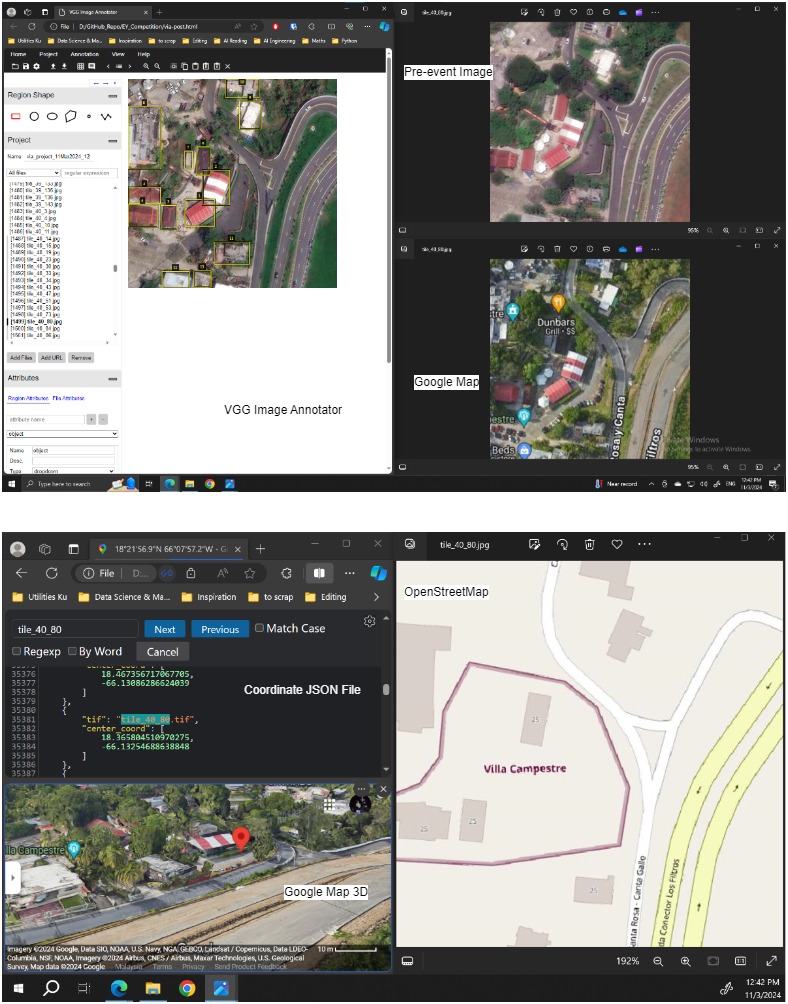
Furthermore, we extracted center coordinates for each tile and leveraged them to access 3D views of the corresponding areas on Google Maps. This enabled us to label all the buildings with high confidence by cross-checking building classes from multiple references. All tiles were then distributed among team members for manual annotation using VGG Image Annotator and in COCO annotation format. Data hosting and version control were managed through GitHub, utilizing Git for seamless working between local and remote repositories. At the end of the competition, we manually annotated a total of 820 images. These annotations amounted to 11,344 labels, distributed as follows: undamaged residential building (7951), undamaged commercial building (2249), damaged residential building (907), and damaged commercial building (237).

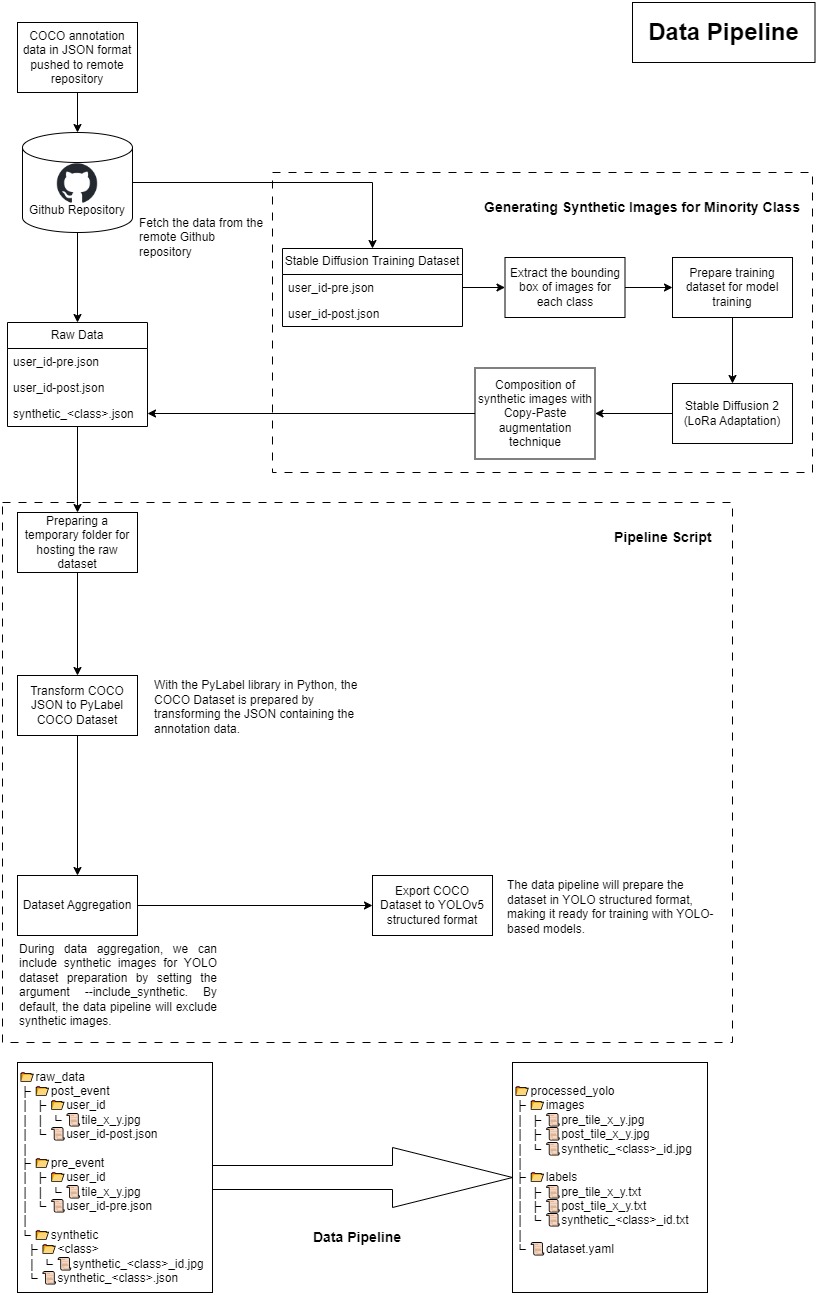
2. Data Pipeline: To streamline workflow efficiency, we developed a data pipeline for data processing and training dataset preparation. This pipeline receives JSON files containing COCO annotation format data and undergoes multiple stages of processing, including JSON to COCO PyLabel dataset transformation, dataset aggregation from multiple inputs, and dataset cleaning. The pipeline ultimately produces YOLO structured files optimized for training YOLO-based models.

3. Training Machine Learning Model: Effective training of the machine learning model requires substantial hardware resources and CUDA acceleration for accelerated training. We trained our model by leveraging Kaggle's cloud platform, which offers generous GPU access of 30 hours per week. Fine-tuning was performed on YOLOv8 pre-trained models provided by Ultralytics, utilizing their high-level framework for efficient model training and evaluation without the need for extensive architectural considerations.

4. Monitoring Machine Learning Training: WandB is used for experiment monitoring, integrated with YOLOv8 training. This facilitated efficient experimentation with various YOLO variants and hyperparameters, enabling us to track and evaluate multiple models effectively. WandB served as a benchmarking tool, aiding in the selection of optimal model configurations and identifying areas for improvement.

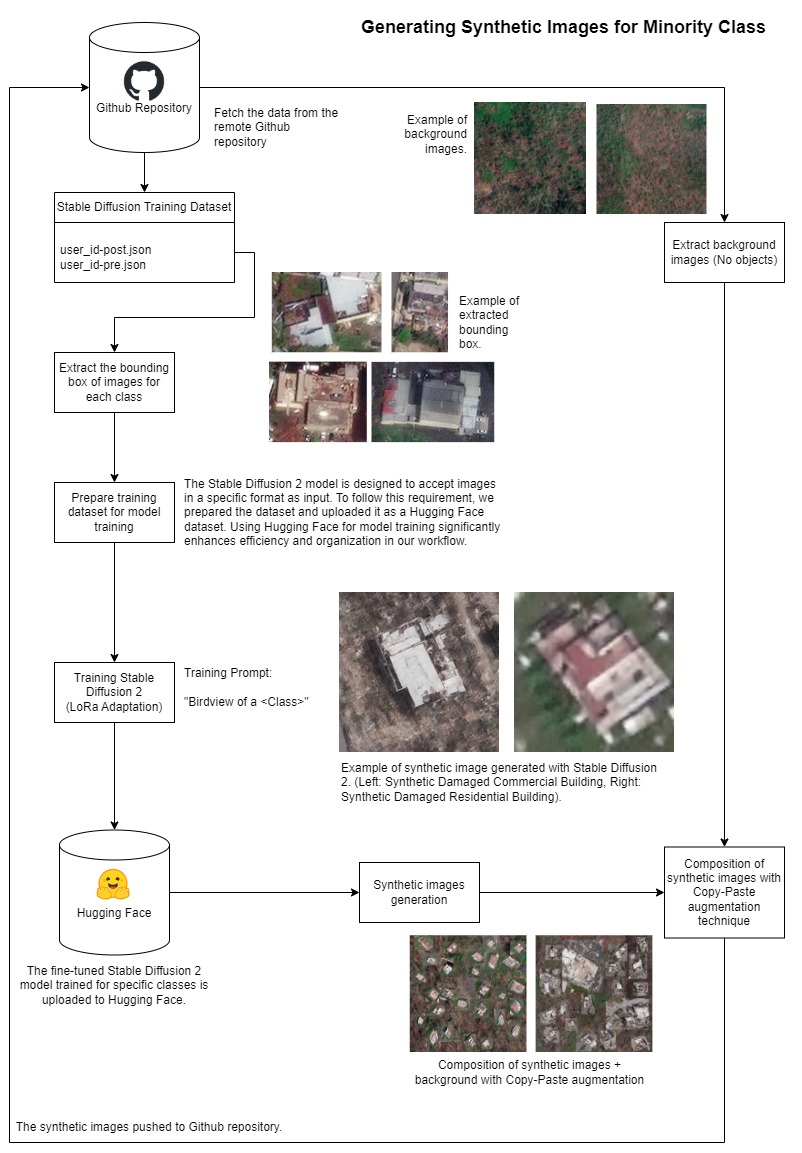
5. Synthetic Image Generation: To generate synthetic images, we chose to fine-tune the Stable Diffusion 2 model by StabilityAI. Training dataset preparation involved extracting images with bounding boxes for each class from our manually annotated dataset, used to fine-tune Stable Diffusion 2 for synthetic image generation. Experimentation with different settings and hyperparameters, including LoRa scale, training epochs was conducted, monitored using WandB. The dataset and trained Stable Diffusion models are hosted on Hugging Face.

6. Evaluating the Trained Model: Trained models were evaluated based on metrics such as mAP50, precision, and recall for each class. Confusion matrices, confidence curves, precision-recall curves, and other metrics were utilized to assess model performance. Evaluation was conducted on WandB, enabling comprehensive analysis to ensure effective predictions for each class.

7. Prediction of Trained Model: Evaluation of the trained model involved testing on 12 validation images provided by the organizers. Results from the detection from each of the validation image (class, confidence score, bounding box coordinates) are saved in a .txt file and all the .txt files are saved in a single .zip file. This zip file is uploaded to the challenge platform to get a score on the ranking board. To enhance scores, prediction configurations were adjusted to minimize bounding box overlap and optimize confidence thresholds.


Preparing Data for Annotation

PrepareData

Figure 1. Preparing data for annotation. Workflow illustrating the process of preparing data prior to annotation.


Annotation Process

PrepareData

Figure 2. Annotation process. We utilized the VGG Image Annotator for annotating the tiles. Each building within the tiles is classified into one of four classes: undamaged residential building, damaged residential building, undamaged commercial building, or damaged commercial building. During annotation, we validated the annotations by comparing them to multiple resources. To determine whether a building is damaged, we compared it between pre- and post-event images, looking for indications of structural damage such as roof loss. To distinguish between commercial and residential buildings, we referred to resources such as Google Maps, OpenStreetMap, and Google Maps 3D. These sources provide information about place names, allowing us to infer whether a given building is commercial or residential. Additionally, having multiple references is beneficial in cases where the pre-event images are obscured by clouds; we compare the building against other resources to verify its classification.


Data Pipeline

PrepareData

Figure 3. Data pipeline. Data pipeline designed to enhance workflow efficiency for processing and preparing training datasets. Begins with the transformation of JSON files containing COCO annotation format data into PyLabel datasets. Subsequently, the pipeline aggregates datasets from multiple inputs and conducts a cleaning process. Ultimately, the pipeline generates YOLO structured files optimized for training YOLO-based models.


Synthetic Image Generation

PrepareData

Figure 4. Synthetic Image Generation. The representation of damaged datasets is notably low. To address the imbalance in the dataset, we implemented methods to balance the training dataset by generating synthetic images. We fine-tuned the Stable Diffusion 2 model from StabilityAI using the training dataset obtained from manual annotations. Specific bounding boxes for classes were extracted from our training dataset and compiled into a Hugging Face dataset, which serves as input for training the Stable Diffusion 2 model. The trained model will then be utilized to generate synthetic images. These synthetic images will be merged with background images using Copy-Paste augmentation techniques. Our approach aims to replicate the methodology outlined in the referenced paper by Jian et al. (2023) titled Stable Diffusion For Aerial Object Detection.


Model

YOLOv8s: Our top-performing model is based on a small variant of YOLOv8 developed by Ultralytics. We are training this pre-trained model, specifically using a resolution of 512x512 and exclusively employing images with bounding boxes. All other images, including unannotated ones and backgrounds without objects, are omitted from our training data. Notably, our dataset consists solely of non-synthetic images. Therefore, our achieved results are solely attributed to the quality of our dataset and the default settings of the model. Through our submission experiments, it's evident that the final score is heavily influenced by the size and quality of the training dataset. However, due to the constraints of time, we have not yet reached a definitive conclusion regarding our model's performance. Given more time for annotation and a larger training dataset, we anticipate that our score could improve from the current 0.48.


Submission Experiment

We conducted a comprehensive series of experiments, submitting a total of 30 entries. Here are select highlights:

Model Score Class Ratio Number of Images Note
YOLOv8n 0.17 (3379 : 371 : 69 : 12) 250 Training from pre-trained weight
YOLOv8n 0.28 (4576 : 876 : 179 : 58) 396 Training from pre-trained weight
YOLOv8n 0.39 (5995 : 1353 : 495 : 130) 473 Resuming training from previous best model (YOLOv8n score 0.28)
YOLOv8s 0.48 (6986 : 1785 : 729 : 183) 661 Training from pre-trained weight

Note: Class Ratio (Undamaged Residential Building : Damaged Residential Building : Undamaged Commercial Building : Damaged Commercial Building)

Further experiments were conducted, including:

  • YOLOv8m: 0.33 - Medium Baseline
  • YOLOv8l: 0.39 - Large Baseline
  • YOLOv8s: 0.30 - YOLOv8s with synthetic dataset addition
  • YOLOv8s: 0.39 - YOLOv8s with reduced prediction confidence threshold to 0.28
  • YOLOv8s: 0.43 - YOLOv8s training with pre-trained weights and AdamW optimizer
  • YOLOv8s: 0.45 - Resuming training from previous best model (YOLOv8s score 0.48) with AdamW optimizer
  • YOLOv8s: 0.46 - Similar to the previous experiment with adjusted prediction threshold configurations

From these experiments, we can conclude that our submission scores are mainly contributed by the quality of the dataset. We managed to achieve the highest score of 0.48 solely from the dataset itself. Our focus was primarily on preparing the training dataset, with minimal time allocated to model development. Given more time, we would explore various training configurations, model backbones, and architectures. Additionally, we would enhance our synthetic image generation models and collect more diverse datasets to further improve our results.


Conclusion and Reflection

1. Dataset is all you need: It is evident that everything comes down to how we prepare the dataset for training a machine learning model. No matter how deep the neural networks are or how sophisticated the model is, if the dataset is of poor quality, our model will never be able to make accurate predictions. Our experiments have shown that with a quality dataset, achieving a minimum of 0.40 is possible, which is sufficient to meet the minimum requirement by EY for a certificate of completion. Our team spent most of the time annotating the dataset and preparing a high-quality dataset. Each label was cross-referenced with reliable sources using Google Maps, OpenStreetMap, and even Google 3D street view to determine the class for each building.

2. Start with a small model: It is advisable to begin with a small model when embarking on a machine learning project. When selecting a model for training, starting with the smallest and lightest model is preferable before moving on to larger and heavier models. The complexity of a model depends on its parameters and the depth of its layers. By starting with a small model, we have more flexibility to expand further with larger models. Our best model is the small variant of YOLOv8, and although we attempted to train YOLOv8m and YOLOv8l, we were unable to surpass our small model. Please note that these findings are based on our experiments, and other teams may obtain different results.

3. Not everything goes your way: Despite our efforts to address the imbalanced dataset by generating synthetic data with Stable Diffusion 2, the results did not meet our expectations. We anticipated that resolving the imbalance would lead to improved model performance, but this was not the case. Several factors may have contributed to this outcome, including insufficient training of the stable diffusion model to generate synthetic data resembling the actual dataset, lack of generalization in the model, and limited variation in the synthetic dataset. It is important to remember that machine learning involves experimentation. By continually experimenting with different settings, architectures, and approaches, we may eventually build a better model through trial, error, and continuous testing and monitoring.


Technological Stack

python ultralytics pytorch kaggle huggingface wandb wandb pylabel